

While an intern with the ISC as part of the SANS.edu Bachelor’s Degree in Applied Cybersecurity (BACS) program, I performed a substantial amount of research and analysis on the daily. While most students install a honeypot locally on a Raspberry Pi to gather attack information, I took extra steps to deploy a personal global network of eleven honeypots. I then developed software to aggregate and analyze the data they provided. I also performed full packet capture on each sensor allowing for even juicier examination of attacks.
Below find published an example of the work performed by analysts in the Internet Storm Center, and my contributions.
Haystacks and Needles: Digging for Interest
DUSTIN DECKER – GFACT, GISF, GSEC, GCIH, GPYC, GCIA, GCWN
This paper details an examination of logs from eleven globally distributed DShield [1] honeypots for February 20th, 2024. DShield honeypots collect a substantial number of repeat alerts.
To overcome this problem, I make substantial use of DShield Manager to analyze and query data using several different formats and methods. DShield Manager is a project I authored during my internship with the Internet Storm Center as part of the SANS Institute bachelor’s in applied Cybersecurity (BACS) program [2]. Project code and documentation are available on GitHub [3].
Data was gathered between October 29th, 2023, 23:04:58 through February 29th, 2024, 23:45:27. The honeypots distributed globally with the help of Microsoft Azure, were retired on March 1st, 2024, at midnight.
Just over 330 gigabytes of data on disk, including various attacks against http, ssh and other services were collected, along with full packet captures, from the following locations:
| Country | Region | City |
| ZA | Gauteng | Johannesburg |
| AU | Victoria | Melbourne |
| HK | Hong Kong | Hong Kong |
| US | Florida | Jacksonville |
| GB | Ireland | Dublin |
| IN | Maharashtra | Pune |
| IL | Tel Aviv | Tel Aviv |
| KR | Sejong | Seoul |
| BR | Sao Paulo | Sao Paulo |
| SG | Singapore | Singapore |
| US | California | San Diego |
Executive Summary of Findings:
A dangerous host was observed initiating connections to three globally distributed honeypots.
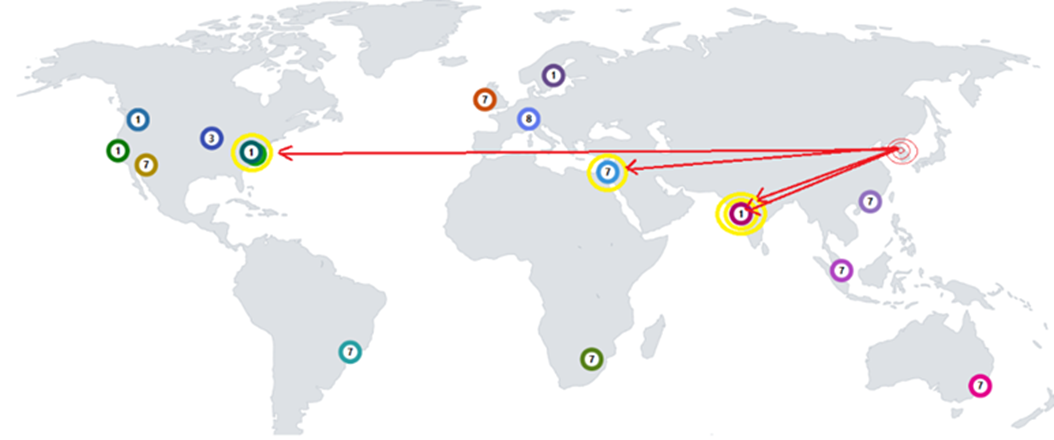
Figure 1: Global Honeypot Distribution
 Figure 2: February Detections Figure 2: February Detections | Host 171.238.59.73 became a focus of investigation due to the nature of a URL appearing in the “Bottom 3 URLs” search query on the india24 web honeypot on February 20th, 2024. Subsequent examination of available data revealed a series of layer 3 attempts to access TCP ports 4369 and 873, and layer 7 attempts to access two distinct URLs, across three geographic locations. The potential for any of the services identified to be exploited if deployed and vulnerable is very high. The likelihood of services and software probed during this incident suffering a follow-on attack from the original scanner, given OSINT information provided later in this report, would be a near certainty. |
Four Important Conversations
1. The first was an attempt to access a suspect URL on February 2nd at 01:32:09 UTC on the sensor eastus24.
2. The second attempted to access TCP port 4369 on sensor india24 on February 2nd at 02:00:14 UTC.
3. The third conversation was an attempt to access TCP port 873 on sensor israel24 on February 17th at 19:49:29 UTC.
4. The fourth and final conversation attempted to access a suspect URL on February 20th at 16:02:04 UTC on the sensor india24.
An overview of applications known to be associated with the suspicious URLs requested and their potential security implications are provided in the technical brief section of this document.
Executive Action Items:
The presence of either of the products identified by the suspicious URLs in a production environment, particularly if exposed to the public Internet, represents a threat to operations. Such hosts and ports, if observed accessible from the Internet, suggest the need to audit the services and ports logged to identify the business application presenting the risk.
Identified business applications need to be remediated with all current software updates and security fixes immediately. Any continued exposure to the Internet should have a significant justifiable business case for remaining. All use of such applications must also be mitigated through more a secure network deployment such as employing an application layer firewall between the system and the Internet.
Technical Brief and Analysis
A useful function of DShield Manager will import web honeypot logs for a given day, and open the webhoneypot.sqbpro project with SqliteBrowser to examine them. The project contains seven canned SQL queries for:
o Most Frequent Source IP (Total)
o Top 5 Source IPs by Sensor
o Bottom 3 IPs by Sensor
o Top 5 URLs by Sensor
o Bottom 3 URLS by Sensor
o Search Source IP
o Search for URL
Executing the “Most Frequent Source IP (Total)” query, for example, reveals 135.181.34.184 is the most frequent Source IP with 299,173 occurrences in the database for the 20th of February.
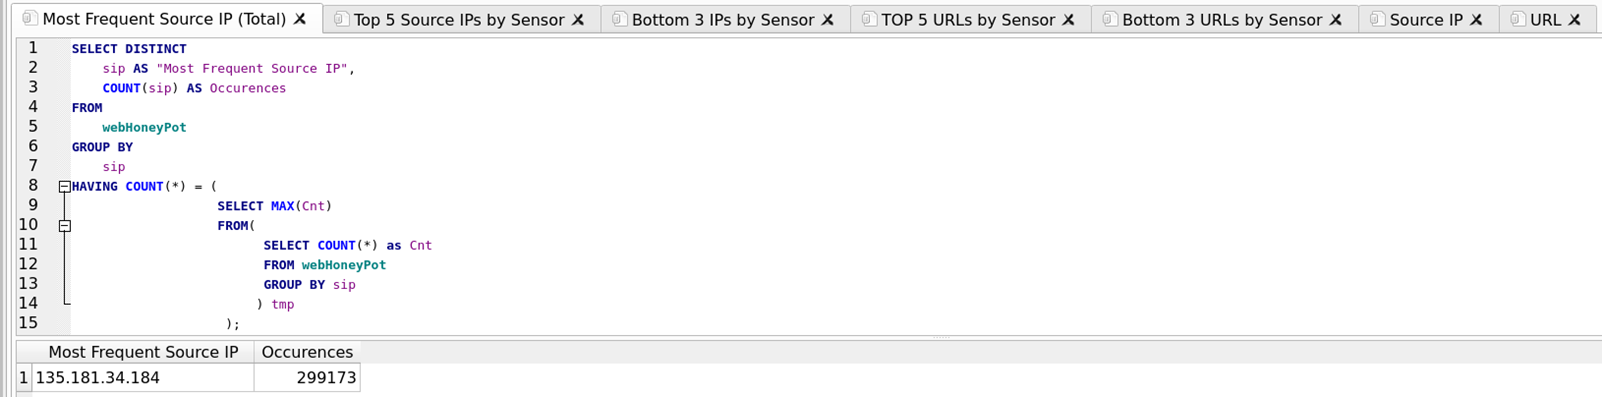
Figure 3: Most Frequent Source IP (Total) and Additional Query Tabs
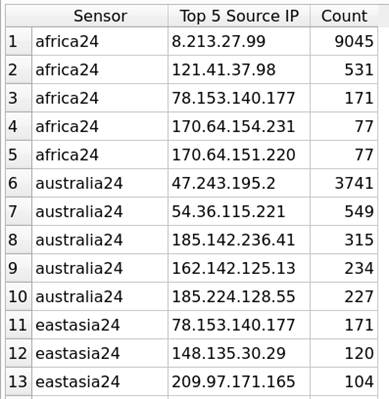 Figure 4: Top 5 Source IP by Sensor Query Results 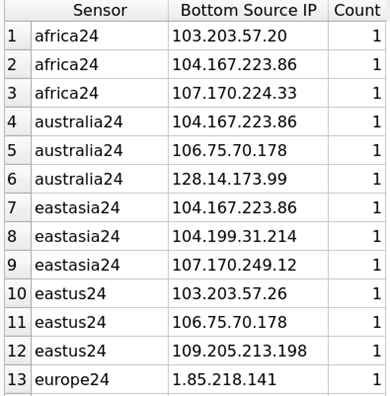 Figure 5: Bottom 3 Source IP by Sensor Query Results | Executing the queries for Top and Bottom Source IP produces a count by Sensor. |
The output of the query of the Bottom 3 URLs requested includes: /DesktopModules/Admin/RadEditorProvider/DialogHandler.aspx
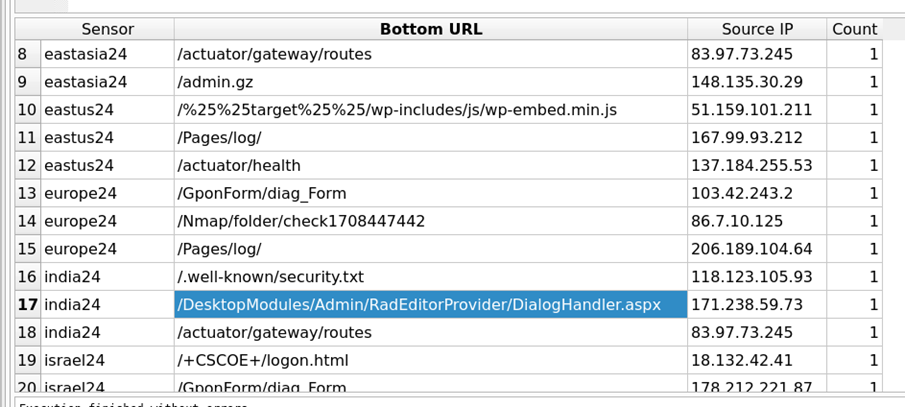
Figure 6: Bottom 3 URLs Query Output
Examining the Bottom 3 URLs by Sensor and then querying the database for the Source IP address of any URL of interest, often reveals additional communications sensors have had with the IP address and additional URLs to examine.
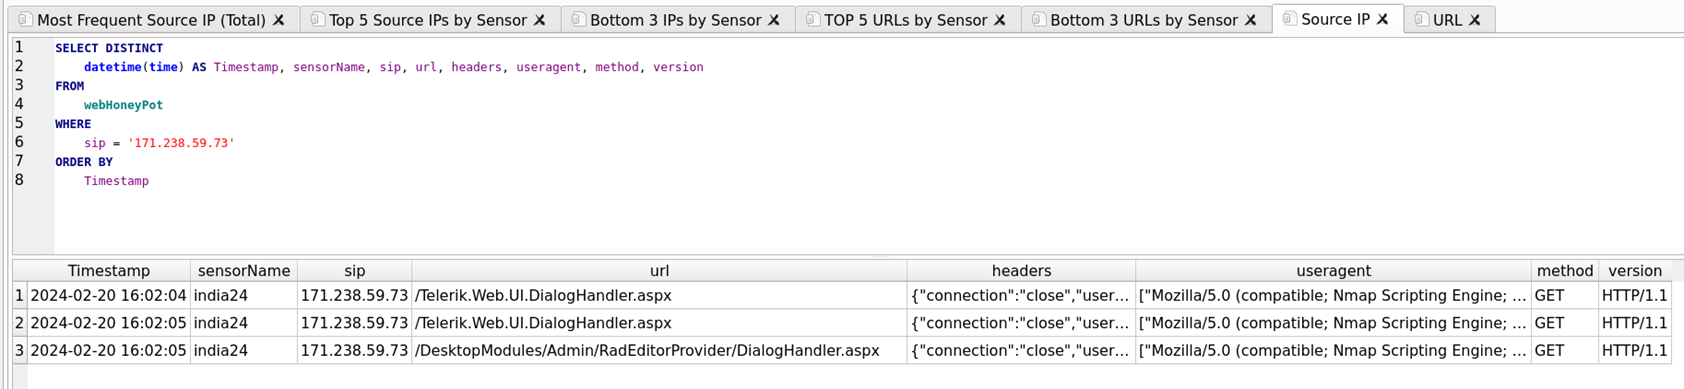
Figure 7: Search by Source IP Query Output
Output reveals additional requests for: URL /Telerik.Web.UI.DialogHandler.aspx
What are these URLs?
Telerik
The URL /Telerik.Web.UI.DialogHandler.aspx is associated with Telerik UI for ASP.NET AJAX, a suite of UI controls for building rich ASP.NET web applications. This URL is specifically related to the DialogHandler class, which is the default dialog handler for Telerik dialogs. It requires Session State to be enabled. This handler doesn’t need to physically exist as it is defined in the <httpHandlers> section in web.config.
However, it’s important to note that there have been security concerns related to this URL. The Telerik.Web.UI.DialogHandler.aspx does not offer built-in authentication.
If the app is not public-facing or if a secure version of Telerik.Web.UI.dll is used then the app will be secured and an attacker won’t be able to access or decrypt the handler [4] [5] [6].
DotNetNuke
The URL /DesktopModules/Admin/RadEditorProvider/DialogHandler.aspx is associated with the DotNetNuke (DNN) content management system.
It appears to be part of the RadEditorProvider, which is a module used for text editing within the DNN platform.
However, it’s important to note that there have been security concerns related to this URL. Some users have reported instances of their DNN sites being hacked through this module. Attackers were reportedly able to upload .aspx files and other files within the DNN folder structure via this URL [7] [8] [9].
The data indicates the source IP is scanning for the presence of Telerik and DotNetNuke. While my Google-Fu hasn’t produced known exploits actively circulating in the wild, a lack of authentication in Telerik and suspected ability to upload .aspx files via DotNetNuke, would be cause for concern in a production environment. No additional connections to the URLs occur short of attempts to access them, so I consider this to be largely reconnaissance on the part of the attacker(s).
What is known about the attacker(s)?
Gatherering information from ipinfo [10], criminalip [11], virustotal [12] and shodan [13] sketches an answer the question. Further analysis will be provided in the OSINT section of this report.
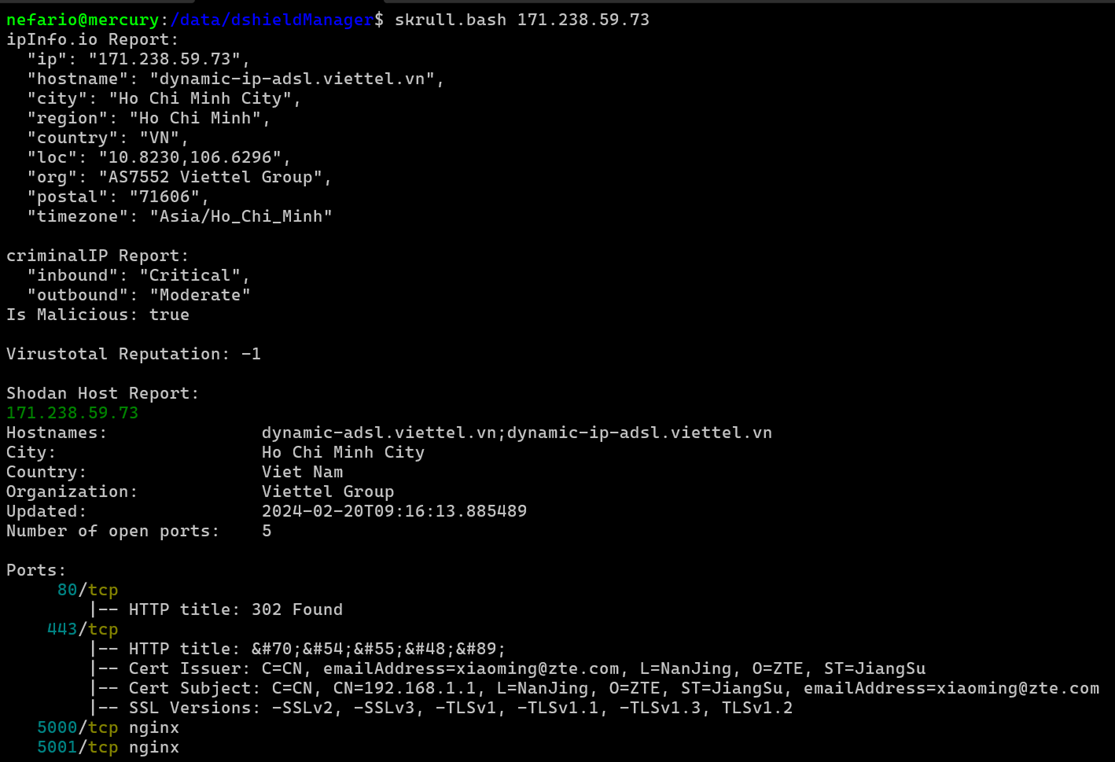
Figure 8: Information Gathering Script.
Interest is in this host and any communications with it in the 2024 calendar year. Making use of the investigation folder for gathering pertinent copies of logs from cowrie, downloads, honeypot logs and packets keeps data together. It’s also a scratch location for performing analysis with Zeek.
Extracting all packets for January/February of 2024 associated with the source IP employs a modified version of the analyze script, written and shared by Dave Hoelzer of Enclave Forensics as part of SANS SEC503: Network Monitoring and Threat Detection In-Depth [14], which he teaches.
Packets are gathered by the script from the india24 sensor, piping them through tcpdump with a capture filter to limit packets specifically to host 171.238.59.73. Splitting it into two passes was required; one for January and another for February and saving the .pcap output avoids the error. File sizes for the two captures indicate the January capture is empty, verified with Wireshark.
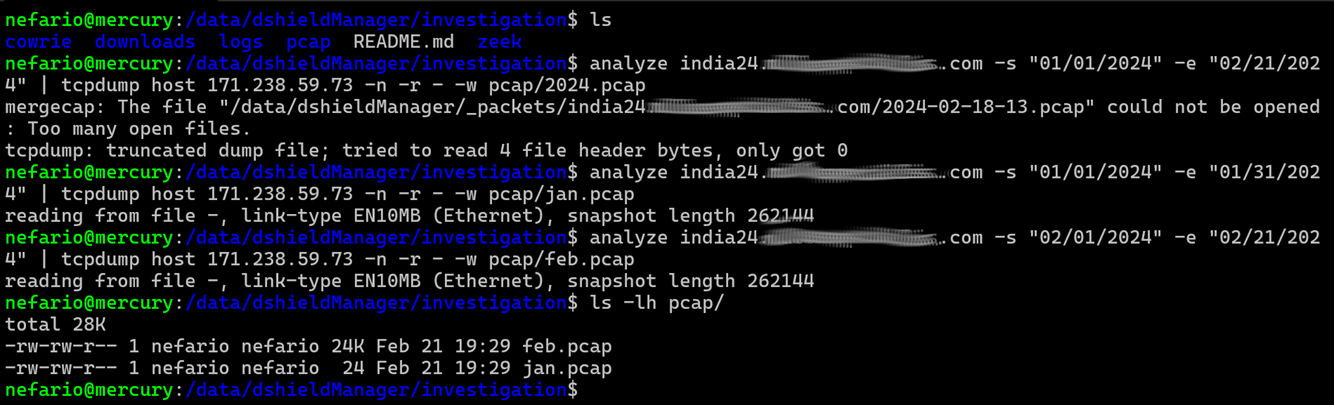
Figure 9: Carving Packets for January and February
Opening the February capture file in Wireshark and examining the Capture File Properties from the Statistics Menu reports a total of 67 packets are included.
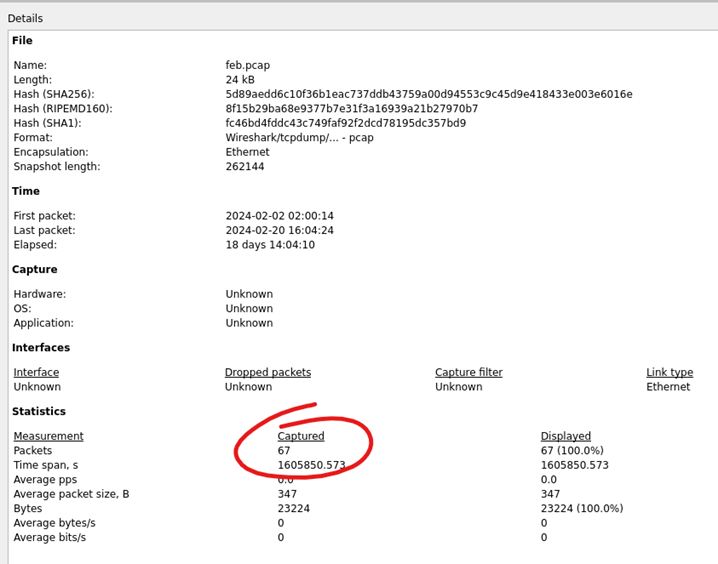
Figure 10: Wireshark Capture File Properties
Opening the Statistics Menu and selecting http, followed by Requests Output, will display all web requests contained in the .pcap file.
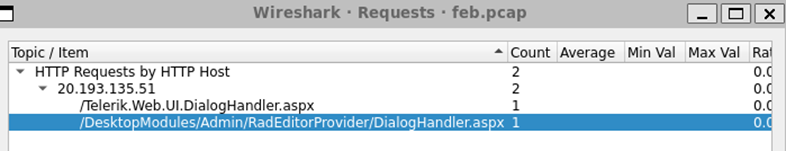
Figure 11: Statistics Menu | http | Requests Output
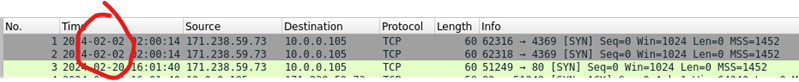
Figure 12: The first two packets in the capture on February 2nd were initially overlooked in Wireshark analysis.
Turn now to another tool covered in-depth in SEC503, Zeek. Zeek is a passive, open-source network traffic analyzer. Many operators use Zeek as a network security monitor (NSM) to support investigations of suspicious or malicious activity. Zeek also supports a wide range of traffic analysis tasks beyond the security domain, including performance measurement and troubleshooting [15].
Begin moving into the zeek directory, executing zeek with the -C option to ignore checksum errors and -r to provide the path to read the feb.pcap file, followed by a directory listing for a look at the output files. Being interested largely in connections, focus on the conn.log file. It’s often difficult to recall which fields each of the various zeek logs provide. Issue a quick grep for the line within the logfile containing fields.
Armed with these fields now pipe the log through the zeek-cut command to display information relevant to the investigation. The -D %m-%d-%Y.%H:%M:%S portion of the command formats the output of the ts (timestamp) field in a human-friendly MM-DD-YYYY.hh.mm.ss format.
cat conn.log | zeek-cut -D %m-%d-%Y.%H:%M:%S ts uid id.resp_p service conn_state history duration
The command displays the timestamp, unique ID, responding host port, service, connection state, connection history, and duration of each connection.
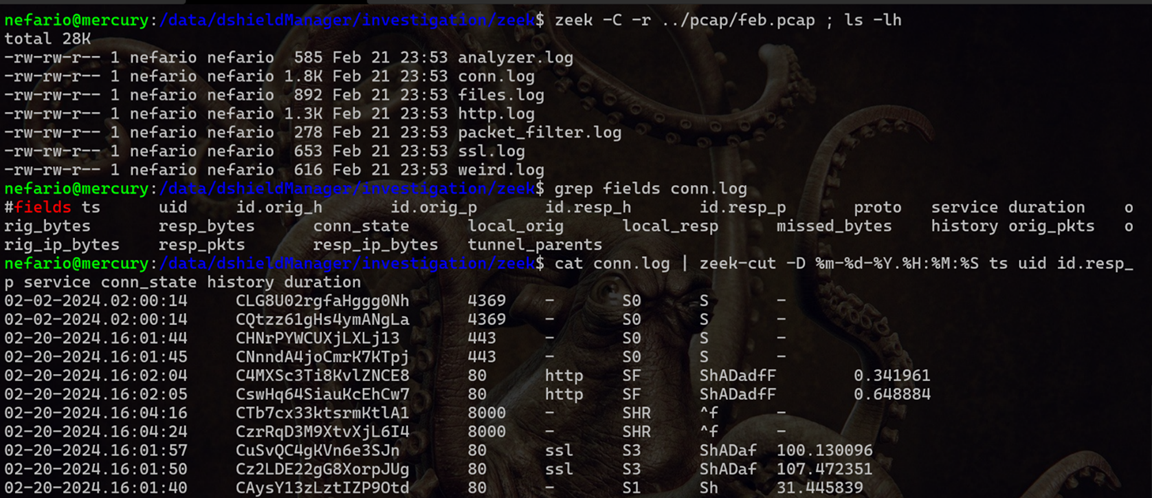
Figure 13: Zeek-cut Output with Selected Fields
Make note of the first two connections from February 2nd to TCP Port 4369. Zeek brought them out of the haystack and more obvious.
The meanings of the output of connection state and history fields are listed below.
conn_state:
S0: Connection attempt seen, no reply.
S1: Connection established, not terminated.
SF: Normal establishment and termination. Note that this is the same symbol as for state S1. You can tell the two apart because for S1 there will not be any byte counts in the summary, while for SF there will be.
REJ: Connection attempt rejected.
S2: Connection established and close attempt by originator seen (but no reply from responder).
S3: Connection established and close attempt by responder seen (but no reply from originator).
RSTO: Connection established; originator aborted (sent a RST).
RSTR: Responder sent a RST.
RSTOS0: Originator sent a SYN followed by a RST, we never saw a SYN-ACK from the responder.
RSTRH: Responder sent a SYN ACK followed by a RST, we never saw a SYN from the (purported) originator.
SH: Originator sent a SYN followed by a FIN, we never saw a SYN ACK from the responder (hence the connection was “half” open).
SHR: Responder sent a SYN ACK followed by a FIN, we never saw a SYN from the originator.
OTH: No SYN seen, just midstream traffic (one example of this is a “partial connection” that was not later closed).
history:
S: The originator sent a SYN segment.
H: The responder sent a SYN ACK segment.
A: The originator sent an ACK segment.
D: The originator sent at least one segment with payload data. In this case, that was HTTP over TCP.
A: The responder replied with an ACK segment.
D: The responder replied with at least one segment with payload data.
F: The originator sent a FIN ACK segment.
F: The responder replied with a FIN ACK segment.
The initial connections from February 2nd are flagged S0 indicating a SYN was seen with no reply. This could be an ordinary SYN scan, but with our honeypot not answering on closed ports this isn’t a definite presumption.
TCP port 4369 is associated with multiple products. The Erlang port mapper daemon (EPMD) [16] is one such product. Erlang is a programming language used to build massively scalable soft real-time systems with requirements on high availability. Some of its uses are in telecoms, banking, e-commerce, computer telephony and instant messaging [17]. The description of industries making use of the product makes for a juicy target, which could explain the interest in the port.
Another product that makes use of TCP port 4369 is RabbitMQ. RabbitMQ is lightweight and easy to deploy on premises and in the cloud. It supports multiple messaging protocols and streaming. RabbitMQ can be deployed in distributed and federated configurations to meet high-scale, high-availability requirements. [18] This description also makes for a juicy target: the softer underbelly of federated systems and messaging.
There remains a third product that makes use of TCP port 4369, albeit by virtue of an embedded instance of RabbitMQ: SolarWinds. SolarWinds Server & Application Monitor (SAM) uses the following ports:
4369 TCP – RabbitMQ messaging (EMPD) [19]
5671 TCP – RabbitMQ messaging (AMQP over TLS/SSL)
5672 TCP – RabbitMQ messaging (AMQP unencrypted backup port)
25672 TCP – RabbitMQ messaging (Erlang distribution)
/data/dshieldManager/bin/VARS includes a bash array of the honeypots utilized frequently in tasks or functions associated with “all sensors”. It is also available for use at the command line once sourced via the alias dshield.
probes=(africa24 australia24 eastasia24 eastus24 europe24 india24 israel24 korea24 southamerica24 southeastasia24 westus24)
Executing a for loop wrapped around the analyze script allows fairly expeditious export of packets for each sensor for the month of February. A directory listing reveals a total of four files large enough to contain output: eastus24, india24, israel24 and westus24. Right away the file sizes suggest scripted or repetitive behavior.
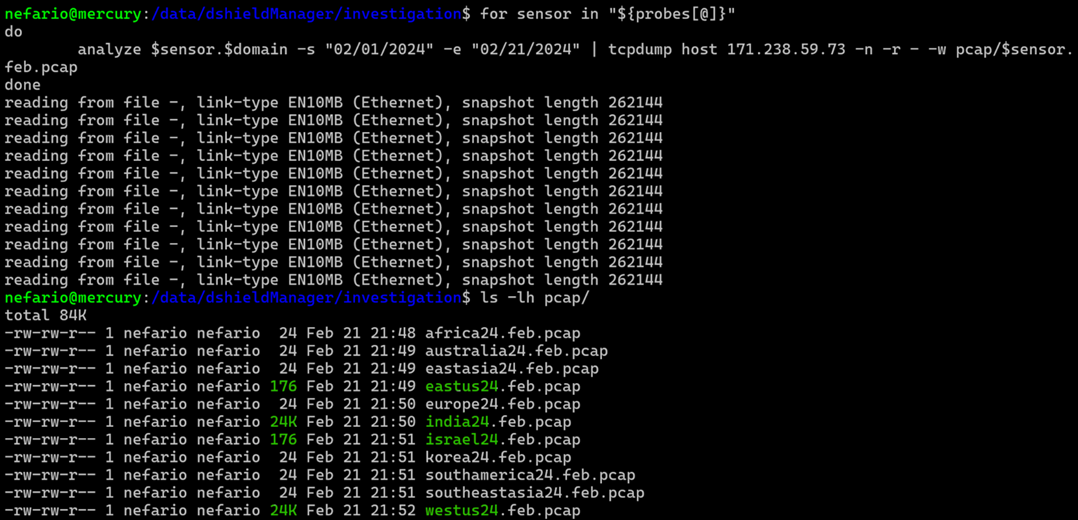
Figure 14: Executing for loop on all sensors to retrieve February packets.
| Opening the two larger files with Wireshark, india24.feb.pcap and west24.feb.pcap, and examining the file properties reveals more of the same, 67 packets each. | |
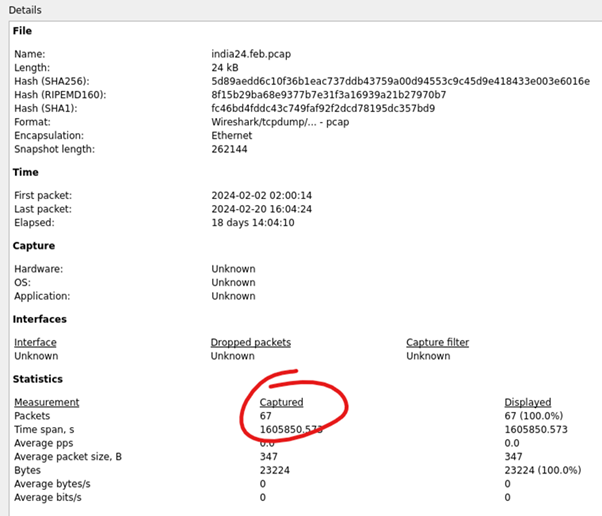 Figure 15: Wireshark Capture File Properties india24.feb.pcap | 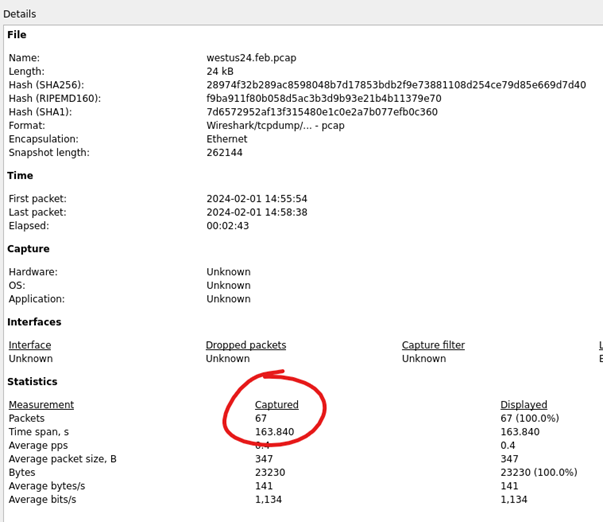 Figure 16: Wireshark Capture File Properties westus24.feb.pcap |
Tshark can simplify this count from the command line:
for X in $(ls pcap/); do echo $X; tshark -r pcap/$X | wc -l; done
What about the captures with only two packets?
Executing tshark -t ud -r pcap/eastus24.feb.pcap quickly reveals again an attempt to connect to TCP port 4369. Utilizing the -t ud flag outputs timestamps in absolute UTC format. These occurred on February 2nd with roughly thirty minutes passing between the eastus24 honeypot and the india24 honeypot occurrences.

Figure 17: Tshark Output
The isreal24.feb.pcap file:
tshark -t ud -r pcap/israel24.feb.pcap
These packets are more unique, occurring on the 17th of February, bound for TCP port 873.

Figure 18: Tshark Output
IANA associates TCP port 873 with the rsync service (as well as UDP port 873) and three well know products utilize it.
1. QNAP NAS uses the following ports:
Web server: 80,8081 TCP and 443,8080 TCP (web admin)
FTP/SFTP/SSH: 20,21,22 TCP and 13131 TCP (telnet)
Remote Replication: 873,8899 TCP
VPN server: 1723 TCP (PPTP), 1194 UDP (OpenVPN)
CloudLink: port 20001 UDP (optional, only required for access without manual port forwarding) [20].
2. The ANTlabs InnGate devices do not require authentication for rsync sessions, which allows remote attackers to read or write to arbitrary files via TCP traffic on port 873 [21].
3. F5 BIG-IP could allow a remote attacker to execute arbitrary code on the system, caused by an error within the ConfigSync Access Control Handler component. By connecting to the rsync service on TCP port 873, an attacker could exploit this vulnerability to gain read or write access to the system and execute arbitrary code on the system with root privileges [22, 23, 24].
Searching for all of 2024 finds the February requests on sensor westus24.
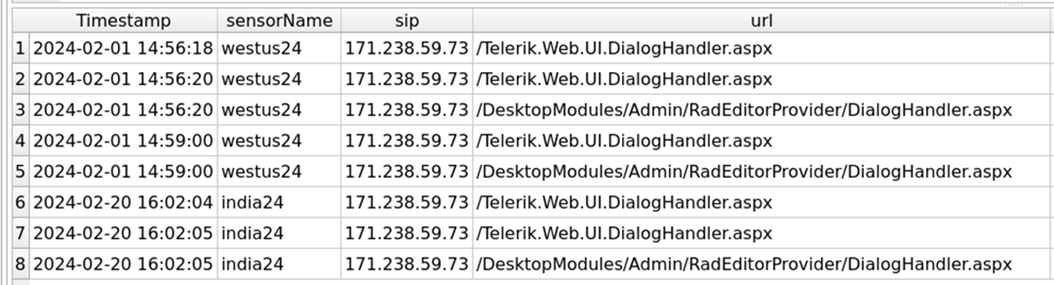
Figure 19: Additional Requests Discovered on January 1st.
The URL /DesktopModules/Admin/RadEditorProvider/DialogHandler.aspx has been seen by other DShield honeypots.
A slight increase in daily submissions occurred in January 2024, creeping up in number of occurrences in February.
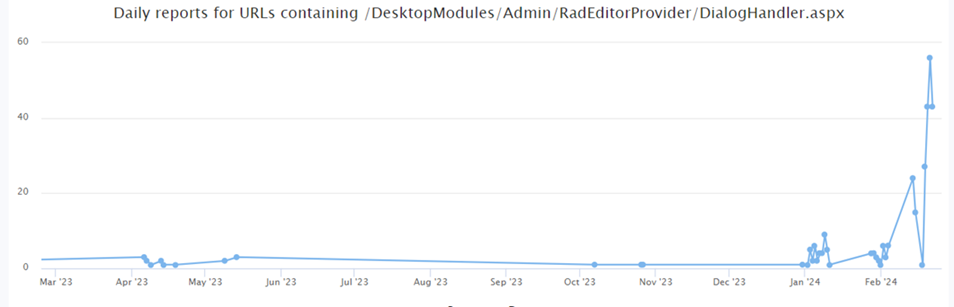
Figure 20 [25]
The URL /Telerik.Web.UI.DialogHandler.aspx has also been seen in the DShield network.
There was a spike in May of 2023. Its current daily reporting rate is quite low.
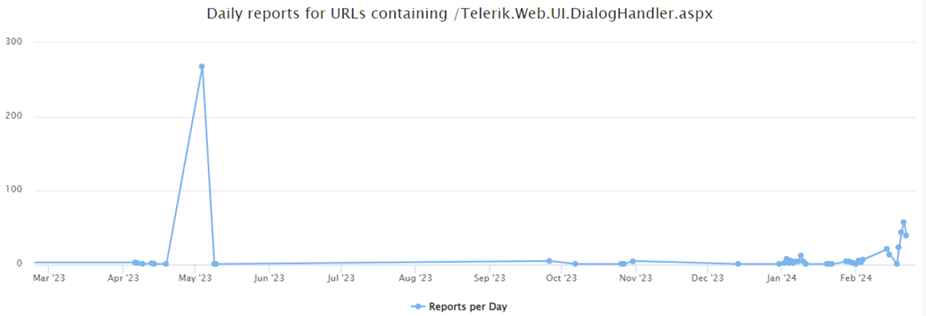
Figure 21 [25]
Historical data for TCP port 4369 looks suspiciously like dates of known SolarWinds exploitations in the wild.
Daily sources, reports and targets have fallen to consistent levels.
TCP port 873 is far more actively scanned, likely due to its association with rsync and QNAP.
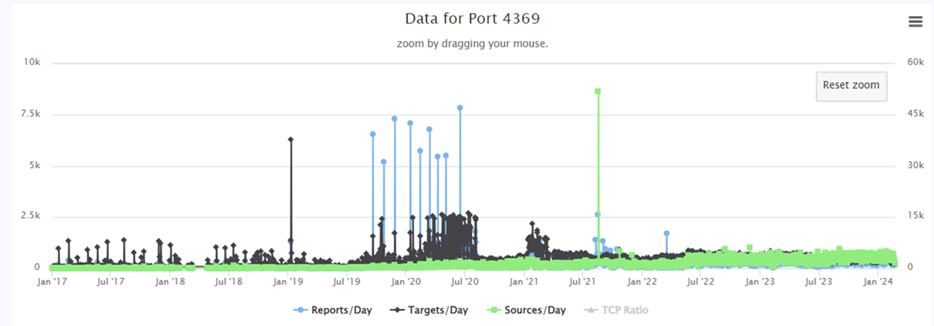
Figure 22 [25]
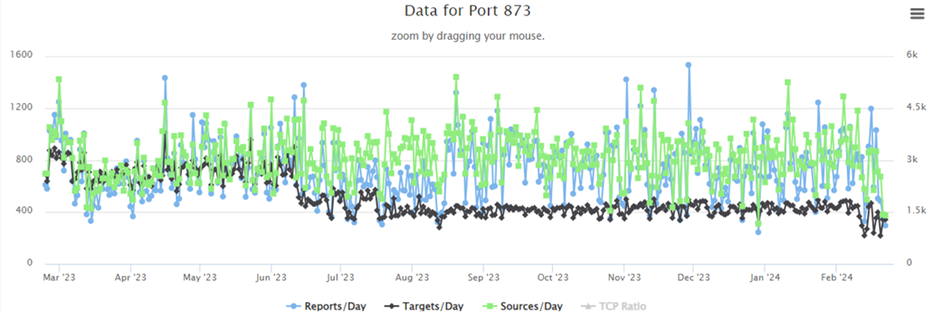
Figure 23 [25]
QNAP NAS allows installation of RabbitMQ in a Docker container. [26]
This substantiates a correlation between both the suspicious URLs and TCP Ports being scanned – it’s a safe hypothesis now that the attacker is searching for vulnerable instances of Synology QNAP NAS units connected to the Internet.
OSINT
Gathering information about the attacker from publicly available sources can aid in assessing associated risks.
A good place to start really digging into a host that’s likely up to no good is Virus Total. Their graphing tool is simply amazing. Beginning with a search for the IP address 171.238.59.73 in Vietnam, double-clicking the host reveals and loads associations. Double-clicking on those associated objects will in turn load their associations.
The further down the rabbit hole one chases information, the wider that funnel seems to get. In very broad strokes the honeypots have been scanned by an IP address in Vietnam that resolves hostnames through Cloudflare to some 800 or more malicious domains. The analysis has stumbled on a thriving criminal enterprise.
A snapshot of the graph will be on the next page. It is also shared on virus total allowing anyone to access it and explore [27].
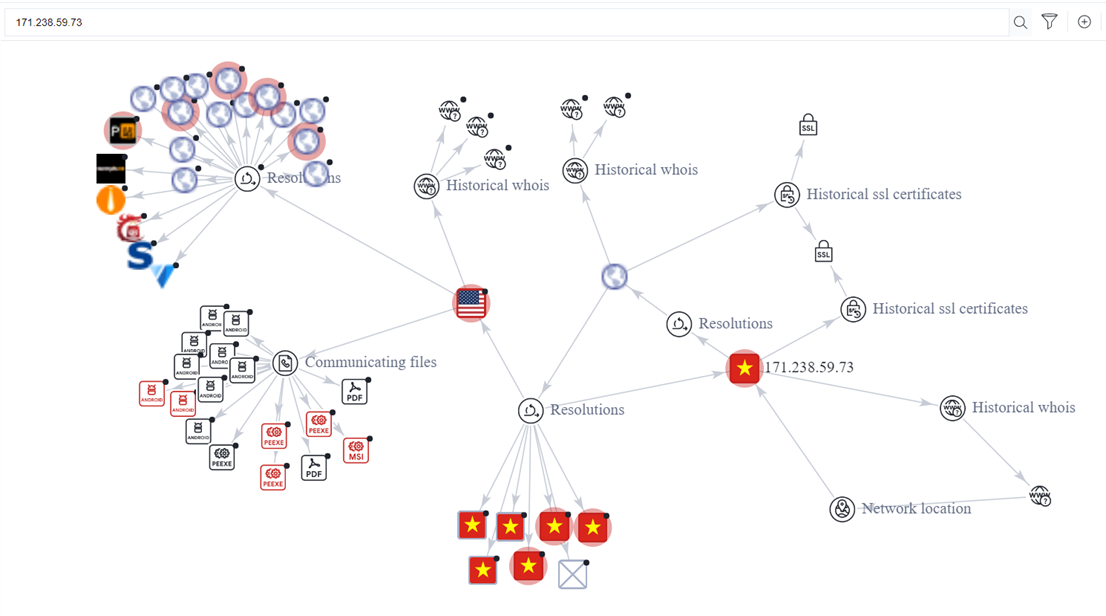
Figure 24: Virus Total Graph
The “Resolutions” node in the top left portion of the graph represents several websites that are hosting the files displayed by the “Communicating files” node, many of which are flagged as dangerous.
The initial load of the Resolutions node, however, did not load every item available because the number of child objects is immense.
Repeatedly loading the node until exceeding the Virus Total quota for the day produced the results displayed here.
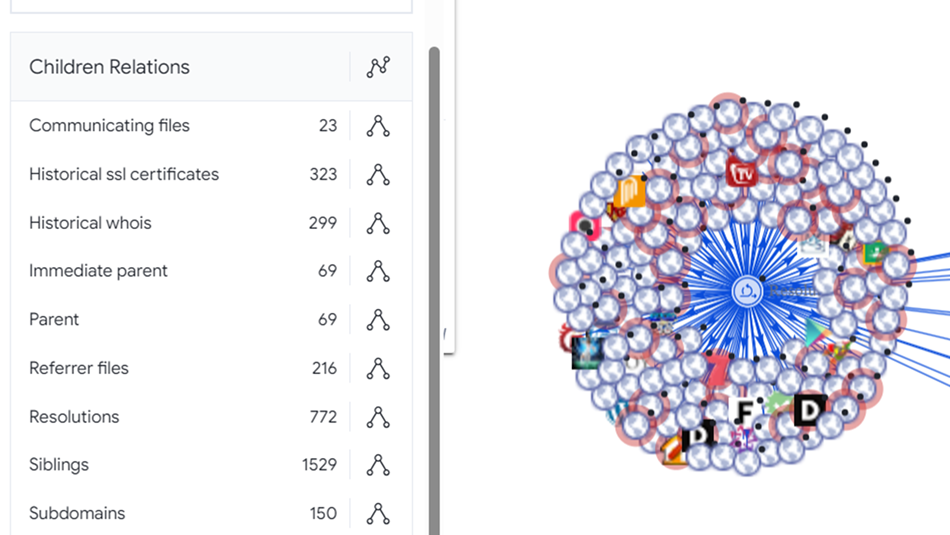
Figure 25: Virus Total Relationships
A single attempt to access a URL on a honeypot left breadcrumbs back to a substantial criminal enterprise!
A couple of the domains identified indicate the type of innocent people being targeted. In the highlighted examples we an presume elderly shoppers and single mothers that may have a down payment saved up to purchase a home – in other words, “something of value to steal”.
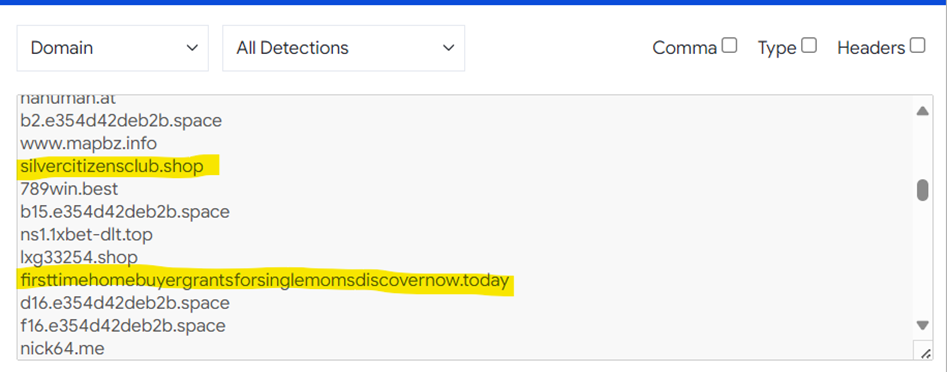
Figure 26: Dangerous hosted domains.
Parting Thoughts
My internship with the Internet Storm Center, though twenty weeks in length, passed far more quickly than I imagined it could. This should NOT have surprised me – on day one mentors warn that it passes quickly.
Not everything I witnessed crossing my honeypots rose to the level of authoring an observation paper as part of my studies, and my studies were not limited solely to the operation of the honeypots. My own journey through the BACS curriculum has been an absolute whirlwind of refreshing and reinforcing the skillsets I need to remain relevant in the final decades of my career while giving me the confidence to avoid imposter syndrome. I take pride in knowing my colleagues who hold GIAC certifications from SANS have worked just as hard to earn them as I have, and that they can be expected to provide trustworthy subject-matter-expert opinions within their respective fields. I’ve attended SANS training since 1999.
I am well versed in many flavors/distributions of Linux having used it in one form or another as my daily driver for a quarter century, while also having cut my teeth on products from Novell and Microsoft earning both CNE and MCSE certifications in the early 2000s. During my career I’ve operated my own security consulting practice, built and sold a successful wireless provider, and worked for the United States Department of Agriculture, where I witnessed one of the most famous supply chain attacks in real time.
My last formal experience with programming was a pair of 100 and 200 level courses in Java at the University of DeVry some twenty three years ago. Despite the Java my mindset has always left me clutching the terra firma of structured programming. Three courses and instructors at SANS changed that for me over the course of six short months, dramatically. SEC573: Automating Information Security with Python, taught by Mark Baggett, literally changed the way I think about code. While writing DShield Manger I often found myself reaching for Python first, regardless of the OS I’m working in.
SEC503: Network Monitoring and Threat Detection In-Depth, taught by David Hoelzer, genuinely intimidated me. I am now significantly more comfortable examining and converting data types that I have long begged others for help with. What’s more, I understand what I’m looking at most of the time.
And finally, SEC505: Securing Windows and PowerShell Automation taught by Jason Fossen, brought the fullness of object oriented programming to fruition. I personally do not consider this course to be an elective – it was instead a self-imposed requisite course. If you work with Microsoft products this course is far more compelling and informative than you may expect. Most importantly, Jason opened my eyes to the just how incredibly powerful object-oriented PowerShell is!
The internship provided me with innumerable opportunities to put new skillsets to the test daily while I also found myself falling into a lifecycle of improvement of both tools and tactics on a similar schedule. I also found, in addition to outstanding mentor support, a thriving community of practitioners putting in the work and sharing results.
Completing remaining coursework and matriculating with a new degree is not the destination. It’s merely a newly poured concrete renovation of the foundation of the house of my continuing security career.
—
References:
[1] DShield Honeypot – https://www.dshield.org/tools/honeypot/
[2] SANS BACS Program – https://www.sans.edu/cyber-security-programs/bachelors-degree/
[3] DShield Manager – https://github.com/1on1security/DShieldManager
[4] https://docs.telerik.com/devtools/aspnet-ajax/api/server/Telerik.Web.UI/DialogHandler
[6] https://www.telerik.com/forums/telerik-web-ui-dialoghandler-aspx-what-directory
[7] https://dnncommunity.org/forums/aft/684
[8] https://www.dnnsoftware.com/answers/potential-security-issues-in-dnn-922178
[9] https://pastebin.com/L8uBeNaS
[10] ipinfo – https://ipinfo.io/
[11] CriminalIP – https://www.criminalip.io/
[12] Virus Total – https://www.virustotal.com/
[13] Shodan – https://www.shodan.io/
[14] SANS SEC503 – https://www.sans.org/cyber-security-courses/network-monitoring-threat-detection/
[15] https://docs.zeek.org/en/master/about.html#what-is-zeek
[16] https://wiki.wireshark.org/EPMD
[18] https://www.rabbitmq.com/
[19] https://www.speedguide.net/port.php?port=4369
[20] https://www.speedguide.net/port.php?port=873
[21] https://www.cve.org/CVERecord?id=CVE-2015-0932
[22] https://exchange.xforce.ibmcloud.com/vulnerabilities/95624
[23] https://www.exploit-db.com/exploits/34465
[24] https://www.cve.org/CVERecord?id=CVE-2014-2927
[25] https://isc.sans.edu
[26] https://blog.iannelson.uk/how-to-install-rabbitmq-server-in-docker-on-a-synology-nas/
[27] Virus Total Shared Graph – https://www.virustotal.com/graph/embed/g4ac6c9f0944c49bb91b8ad24dd8643f496fb870d8c2543168762e4799518093a?theme=light